Time and Frequency Domains
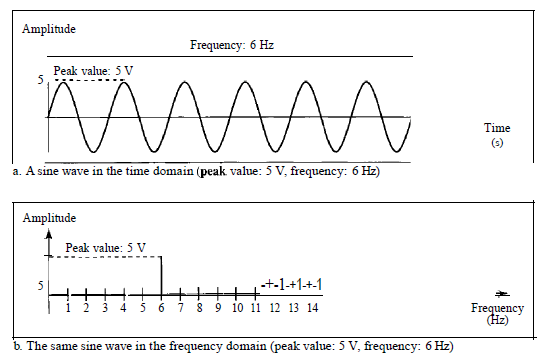
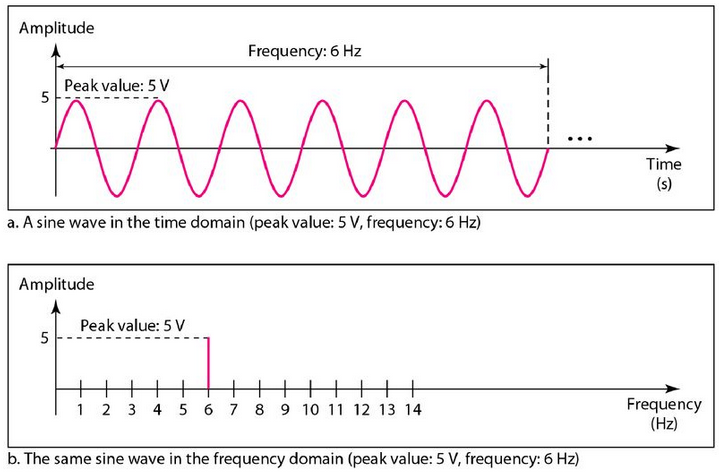
Time-Domain Plot: shows changes in signal amplitude with respect to time (it is an amplitude-versus-time plot); phase is not explicitly shown on a time-domain plot.
Frequency-Domain Plot: shows the relationship between amplitude and frequency; concerned with only the peak value and the frequency; changes of amplitude during one period are not shown.
|
|
The frequency domain is more compact and useful when we are dealing with more than one sine wave. This figure shows three sine waves, each with different amplitude and frequency. All can be represented by three spikes in the frequency domain. image::time-domain-and-frequency-domain-plots-of-a-sine-wave-example-1.png[] |